Infographics That Earn Links
Make data shareable and link-worthy. We turn your insights into visuals that publishers want to cite.
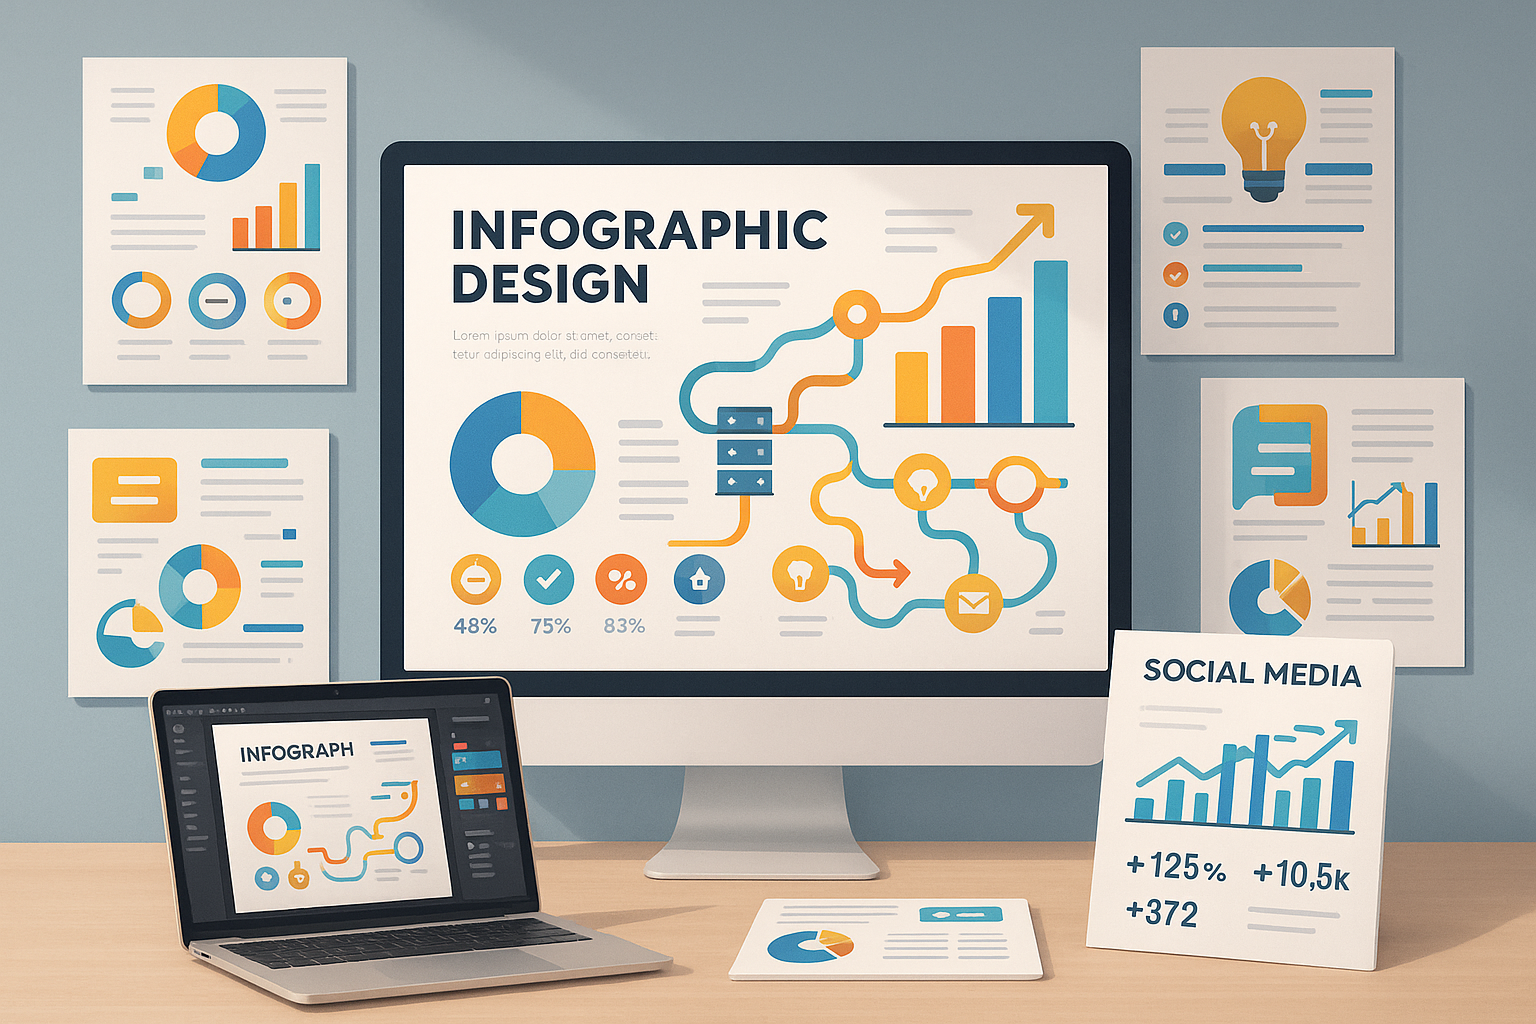
What We Offer
We uncover the story, source the data, and design visuals that land your point fast-charts, flows, and comparisons that editors and audiences keep.
Each asset is built for distribution: PR pitches, social crops, embed codes, and lightweight files that load fast on landing pages.
Goal: links, shares, and time-on-page that lift both SEO and conversions.
Data Visualization
Charts, graphs, and visual representations that make data understandable.
Information Design
Clear hierarchy and flow that guides readers through complex topics.
Custom Graphics
Original illustrations, icons, and visual elements supporting your message.
Social Optimization
Formats optimized for sharing on social media platforms.
Link Building Value
Shareable assets that attract backlinks and improve SEO.
Multi-Format Delivery
Files for web, social media, presentations, and print.
How We Work
Our streamlined process ensures smooth delivery, clear communication, and measurable results from start to finish.
Discovery & Planning
Analyze your business goals, target audience, and technical requirements to create a strategic roadmap.
- Business goals analysis
- Technical requirements
- Project roadmap
Design & Prototyping
Create user-centered designs with interactive prototypes for your review and feedback.
- UI/UX design
- Interactive prototypes
- Design approval
Development & Integration
Build with clean, scalable code and integrate all necessary tools, APIs, and third-party services.
- Frontend & backend development
- API integration
- Third-party services
Testing & QA
Rigorous testing across devices, browsers, and scenarios to ensure flawless functionality.
- Cross-browser testing
- Mobile testing
- Performance optimization
Launch & Deployment
Smooth deployment to production with SEO setup, analytics, and technical configurations.
- Production deployment
- SEO foundation
- Analytics setup
Support & Maintenance
Ongoing monitoring, security updates, and performance optimization to keep everything running smoothly.
- 24/7 monitoring
- Security updates
- Performance optimization
Technologies We Use
We work with modern, battle‑tested tools and technologies to deliver reliable, scalable results.
Flexible Pricing Plans
Choose the plan that best fits your needs and budget
Starter
- Single Topic Infographic
- 5 Data Points
- Standard Design Template
- 2 Rounds of Revisions
- High-Resolution PNG
- Custom Illustration
- Animation
- Multiple Formats
Professional
- Complex Topic Infographic
- 15 Data Points
- Custom Design Style
- Unlimited Revisions
- Multiple Formats (PNG, SVG, PDF)
- Custom Illustrations
- Basic Animation
- Source File Included
Enterprise
- Multi-Part Infographic Series
- Unlimited Data Points
- Bespoke Visual Design
- Unlimited Revisions
- All Digital Formats + Print Ready
- Professional Illustration Work
- Advanced Animation & Interactivity
- Dedicated Designer & Priority Support
Frequently Asked Questions
Everything you need to know about our services
What types of infographics do you create for marketing?
How do infographics help with SEO and link building?
How much does a marketing infographic cost?
What do you need from us to create an infographic?
What formats and sizes do you deliver infographics in?
Ready to Get Started?
Let's bring your project to life with our expert team and proven process